Harper Richter · 20 September 2026
Watershed Data from Oaklyn Fuels Development of Interactive Historical Art Installations
Local artists in Oaklyn have begun incorporating detailed watershed data into a series of interactive history exhibits that opened for public viewing in early 2026, with additional installations scheduled for completion by September 2026; these projects draw directly from hydrological records maintained by regional monitoring stations that track precipitation patterns, streamflow rates, and sediment levels across the municipal boundaries.
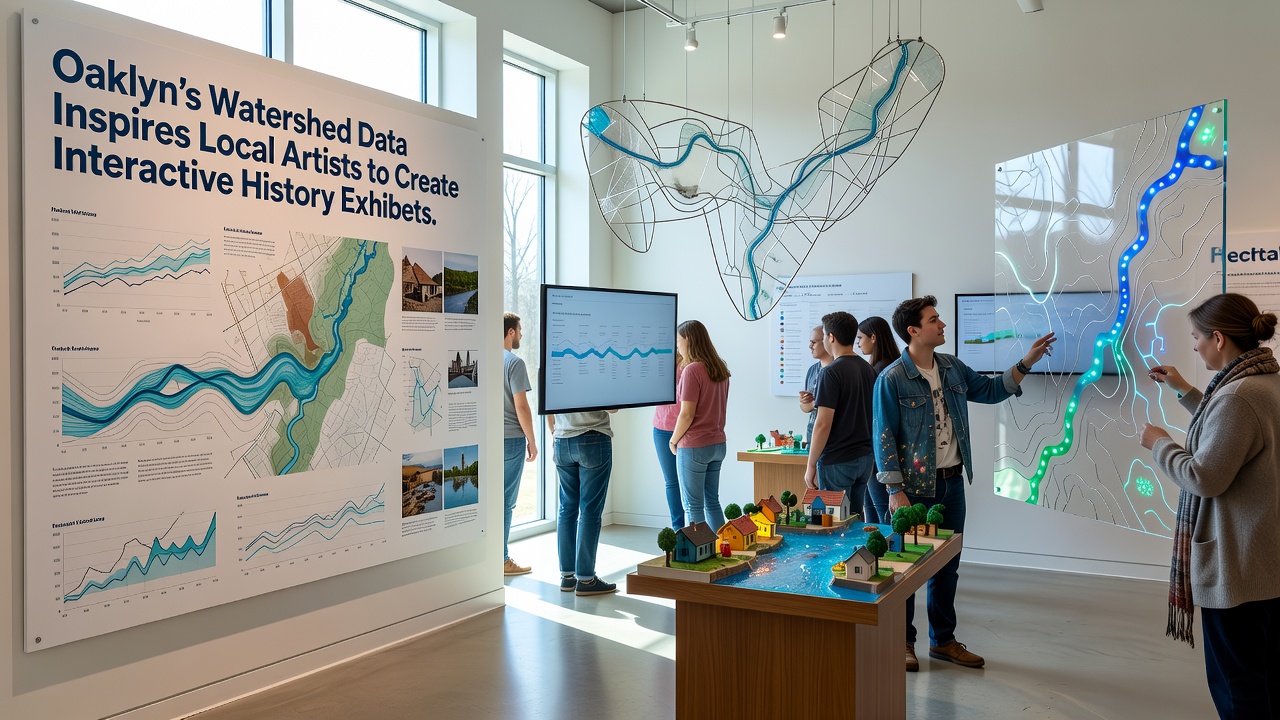
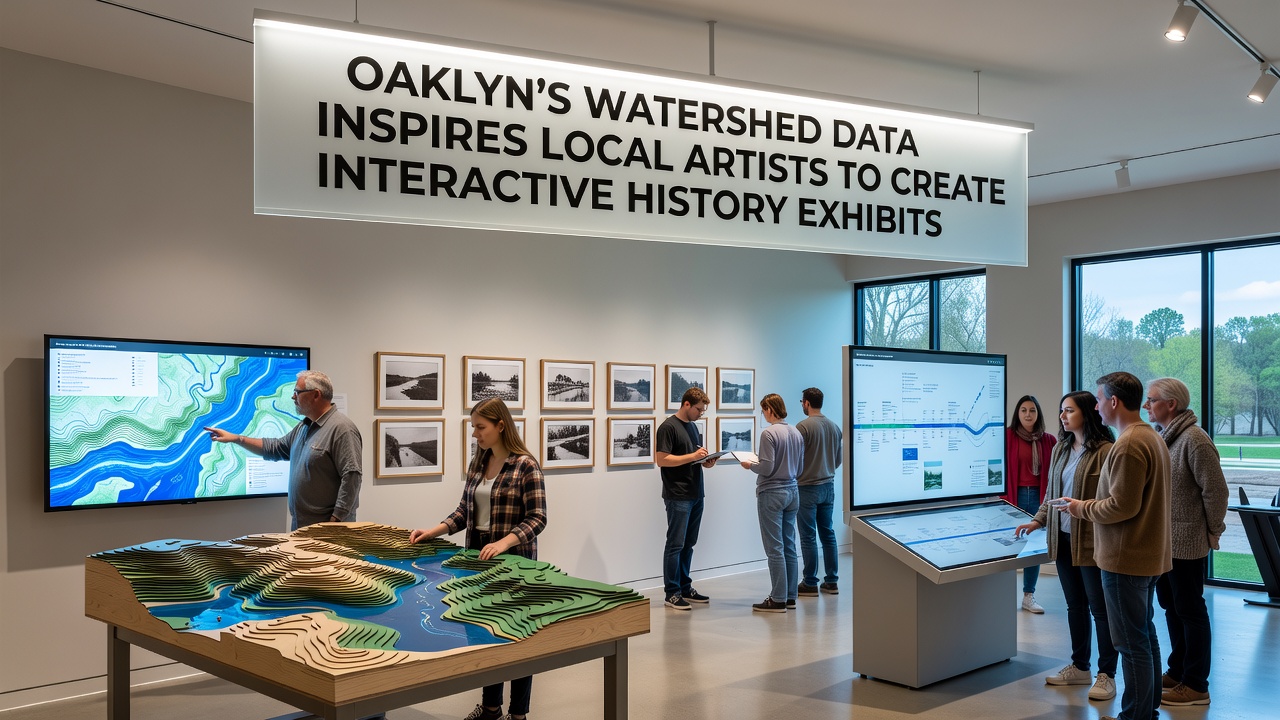
Data compiled over multiple decades reveals consistent seasonal variations in water volume through the main creek system, and artists have mapped these variations onto physical models that allow visitors to adjust digital overlays showing how land use changes from the 1800s onward altered drainage routes; one installation uses pressure-sensitive panels connected to real-time sensor feeds so that stepping on certain floor sections triggers projections of historical flood events documented in municipal archives.
Data Sources and Artist Collaborations
Environmental monitoring programs operated by the United States Geological Survey have supplied the core datasets that artists accessed through public portals, while similar records from Environment and Climate Change Canada provided comparative benchmarks for regional river systems; these combined sources enabled creators to construct layered timelines that connect water management practices in Oaklyn to broader North American patterns observed during the industrial expansion period.
Teams consisting of local sculptors, digital programmers, and historians worked together on three primary exhibit modules, each focused on a distinct era when watershed alterations coincided with population growth spikes; the modules include touch-sensitive riverbed replicas that display archival photographs when activated, along with audio components that play recorded oral histories from residents who described changes in fishing and farming activities tied to water levels.
September 2026 Milestones and Public Access
Planning documents indicate that the final phase of the project will incorporate updated readings collected through September 2026 from automated gauges installed along the creek banks, and these fresh measurements will feed into an augmented reality component accessible via mobile devices; visitors will scan markers placed throughout the exhibit space to view superimposed animations illustrating how current watershed conditions compare with those recorded in 1926 and 1976.
Community workshops held throughout the preceding year allowed residents to contribute personal documents and photographs that supplement the official hydrological data, resulting in hybrid displays where family stories appear alongside quantitative graphs of annual rainfall totals; one such display features a large-scale map that lights up specific properties when corresponding water quality samples from historical testing periods are selected through an adjacent control panel.
Technical Elements and Exhibit Mechanics
Each installation employs open-source software frameworks to process the incoming watershed datasets, converting numerical values for discharge rates and pH levels into visual and tactile outputs that respond to user input; programmers integrated these systems with LED arrays embedded in transparent acrylic panels so that color gradients shift in real time to represent fluctuations documented in the source material.
Observers note that the exhibits avoid static presentations by requiring active participation, such as turning a crank mechanism that simulates water diversion structures used in earlier agricultural operations; this action simultaneously updates a digital readout showing corresponding changes in downstream flow measurements drawn from archived station logs.
Additional modules under development will address industrial pollution events recorded in the mid-20th century, using chemical composition data from past sampling efforts to generate scent diffusers that release mild approximations of historical conditions when triggered by proximity sensors; these elements remain in testing phases ahead of the September 2026 rollout.
Conclusion
The integration of watershed records into public art installations demonstrates how quantitative environmental information can support interpretive displays of local history, with ongoing data collection ensuring that future updates reflect the most recent measurements available from established monitoring networks.